Image Processing: Assignment 2
CS 6640
Project 2
Atlasing and Registration
###Table of Content###
- Shapes
- Brain Images
- Presidential Portraits
- Discussion
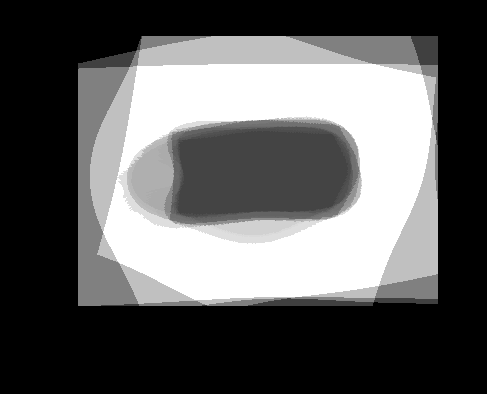
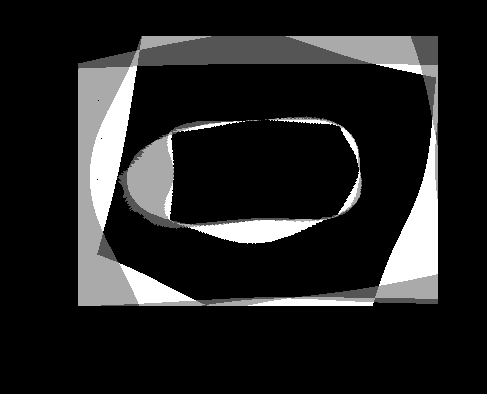
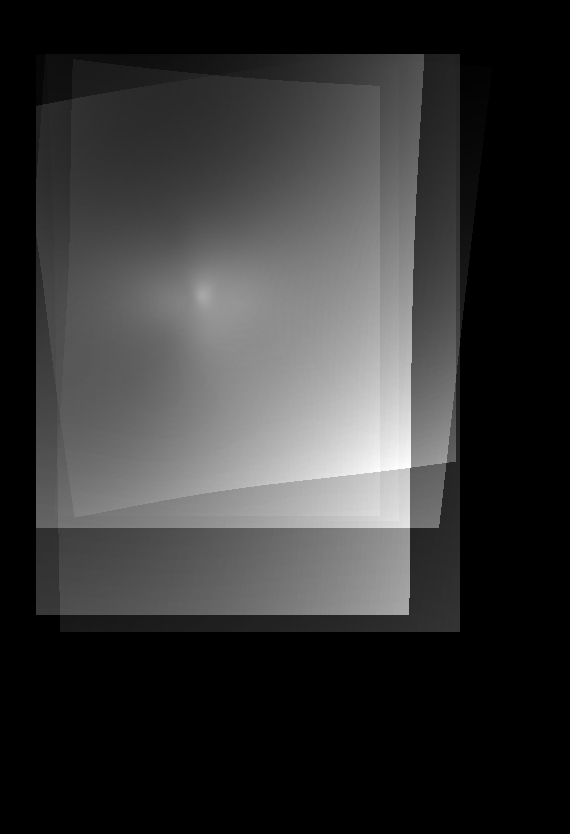
| Atlas | Intensity | Shape variance |
 |
 |
 |
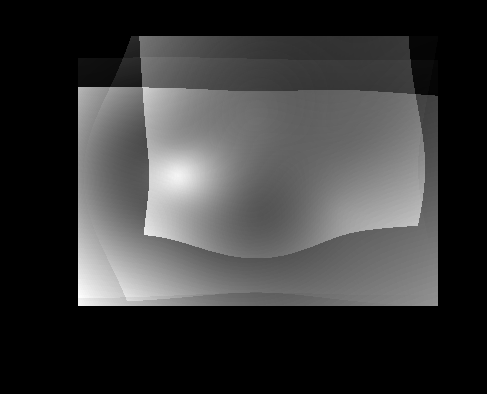
| Atlas | Intensity | Shape variance |
 |
 |
 |
| Atlas | Intensity | Shape variance |
 |
 |
 |
| Chester Arthur | Thomas Jefferson |
 |
 |
| John Q. Adams | Abraham Lincoln |
| port-jqadams | port-linc |
| Rutherford Hayes | Zachary Taylor |
| port-rb-hayes | port-zach-taylor |
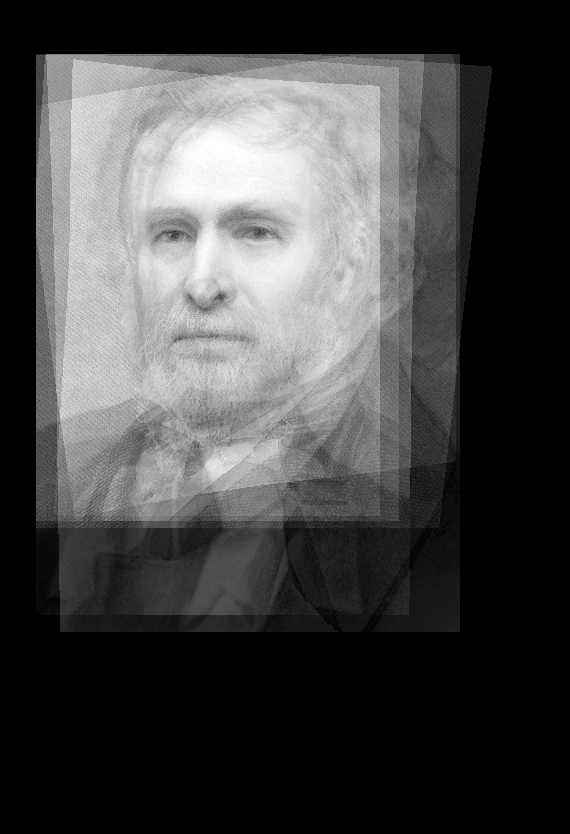
###Correspondence Points for Presidential Portraits###
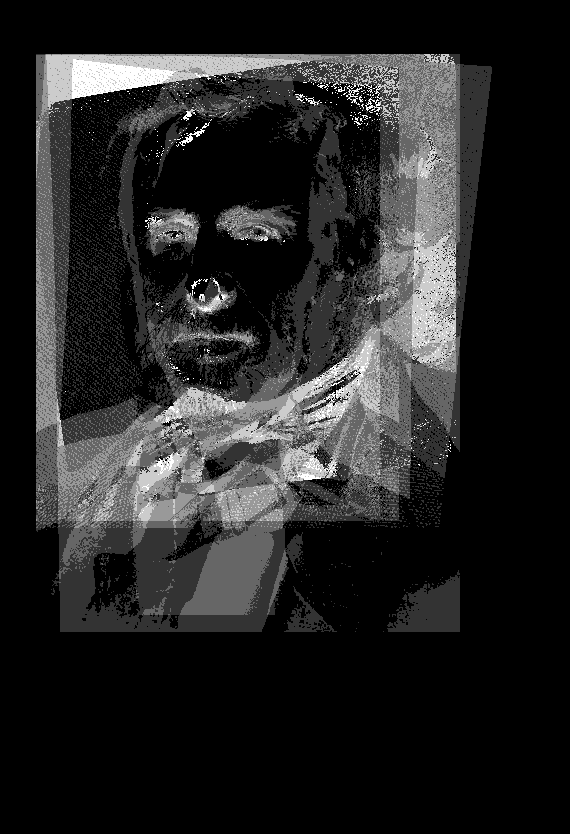
####Contrast Matching#### The best way would be to average all the CDFs (but aren’t we already doing that with the atlas?). Instead, I chose to use histogram equalization, which seems to give reasonable output. However it would have been better to do histogram matching, but there is only so much time in a single day. =D Also, I spent time playing with the number of bins for histogram equalization, but the setting I chose worked well for the shapes. It didn’t occur to me to play around with it as well for brains or the portraits. More dials to twiddle with I suppose.
####Output Size#### If you look at the atlas.m code, you’ll see that I initially run through each figure and pre-warp each corner and figure out the maximum in x and y and the minimum in x and y. This occurs after I figure out the "average" image. I figure this would give a "good enough" bounding box. Its very easy to think of cases where parts of the image could still end up outside the bounding box and it would be trivial to adjust for this as well: just run it along all the edges. But, for this assignment (and the given inputs) its unnecessary.
However, looking at my images again, it seems that something is not quite right. There is a lot of black border in all my images. But, this also might be because of scaling factors, but I doubt it because averaging the images should take care of that. Nevertheless, the image size created handily supports all the images that I throw at it, so I’m not too concerned.
####How is the quality of the atlas (shape, variability) affected by the number of control points?####
You have to have enough control points. Without enough control points the transformation doesn’t look right, i.e. things don’t line up properly. For instance, I picked portraits because there are easily identifiable structures on a face: eyes, nose, and mouth (and to a lesser extent ears, forehead, wrinkles etc). I chose to concentrate on the eyes, nose and mouth though. If you look at the example correspondences image, you’ll see that I placed multiple correspondence points on the eyes as well as the mouth. These objects on the face are crucial in getting a proper warp.
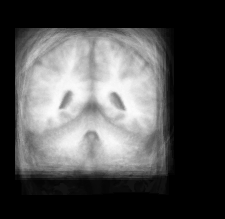
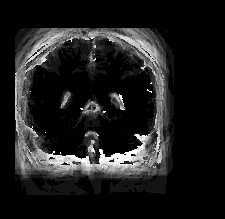
####What Kinds Points Are Easily Found Among The Different Brain Images?####
I had to look up some more information about the brain. I found an image here to be useful in figuring out correspondence points.
- central fissure
- corpus callosum
- lateral fissure
- lateral ventricles
- occipital lobe
- third ventricle
I’m not gonna lie, I have no idea whether or not I labelled any of the correspondence points properly. I think I got pretty close, but some features seem to disapear in some images.
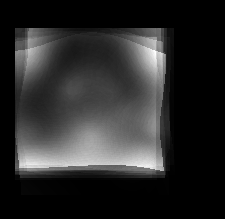
####What is the effect of removing rotation, translation, and scaling from the shape variation?####
####Shape Variance with rotation/scaling/translation removed####
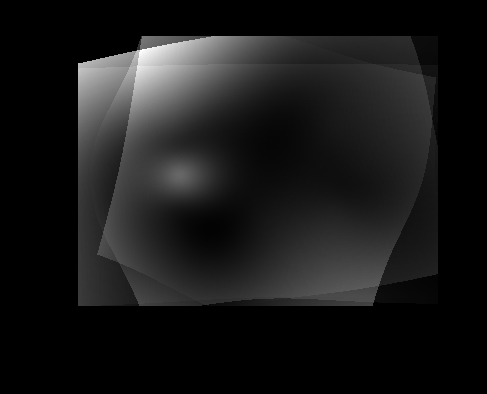
| Shape Variance (rigid) | Brain Variance (rigid) |
 |
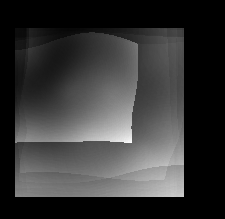 |
I found this part of the assignment to be the most confusing aspect. But, it all clicked together right before I needed to turn the project in. I solved for the rotation/scaling using SVD and the affine transformation matrix.
[U S V] = svd(A);
And U’V is the rotation and the trace of S is the scaling. Very cool stuff indeed.
Once I had this information, I created new correspondences and a new "average" image and proceed to go through the TPS warp again.
####But what does it all mean?####
Looking at the non-rigid vs the rigid, I don’t really see that much of a difference. And when you think about it, for the shape and the brain images, that makes sense because the images are all the same size (respectively) and the "shape" of the image aren’t that different (especially the brain). So, these control samples wouldn’t have significantly different shape variance between images with the transformations removed and those that do not have the transformations removed because in the end, the shapes are similar for both the brain images and the shape images. I would expect images that have significant variation in the shape, like significantly different perspective of the same objects, to have the removal of the transformations show up in the shape variation more significantly.
####From your experiments how does the accuracy of the control points affect the results?####
| Atlas | Intensity | Shape Variance |
 |
 |
 |
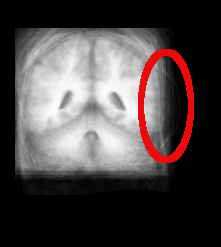
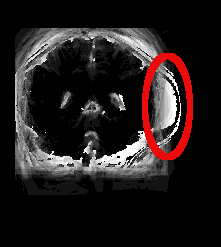
####Comments#### This was an early attempt on my part to come up with correct correspondence points for the brain scans. And, as you can see, I didn’t do so well. Anything in red was added after the images were generated to highlight what I’m discussing here. As you can see, poor placement of correspondence points in the final image (IBSR_16_ana_normalized_cropped_slice_42.tiff) lead to the massive brain tumor on the right side. This brought up the whole discussion earlier about whether I had actually labelled anything properly. But, as you can see mislabeling even a single image can lead to some awful results.